“Section 1: Purpose of the Survey: The purpose of this survey was to gather a high-level view of U.S. Group Term Life Insurance mortality results during the COVID-19 pandemic, as compared to prior period baseline mortality results….
2.1 Background
Carriers provided a complete set of monthly Group Life exposures dating back to January 2017, along with all Group Life death claims reported in January 2017 or later. The reported death claims also identified the months of death, i.e., incurred months.
Exposures and deaths during the three-year period of 2017–2019 were used to set baseline mortality expectations. The dataset for this report encompasses all Group Life claims reported to participating carriers as of March 31, 2022…
2.3 Survey Highlights …
Additional highlights include the following:
- Approximately 13% of all reported Group Life claims with death dates in the pandemic period were determined to have a cause of death of COVID-19…
- Early quarters of the pandemic period (Q2 and Q3 2020) showed the Group Life insured population studied within this survey experienced a lower percentage of excess deaths than the U.S. population. Beginning in the fourth quarter of 2020, this relationship flipped, with subsequent quarters indicating higher excess mortality for the Group Life insured population by a percentage difference ranging from 2% to 10% (additive) by quarter
5.4 Age and Sex
For the Age and Sex segments, excess mortality for the pandemic period was split between COVID and non-COVID claims. For example, for the 45–64 age group, the 25.1% COVID and 8.1% Non-COVID total 33% excess mortality, which equates to the 133% A/E [actual-to-expected] ratio since April 2020. Generally, the 65+ age band continues to have lower A/E ratios. However, the bulk of excess mortality for this age group (which includes retirees) was identified as COVID. Cumulative A/E ratios have been similar since April 2020 for the 0–44 and 45–64 age bands, but the recent improvement has been more dramatic for the 0–44 age band after experiencing an extremely high A/E ratio in Q3 2021. A much greater proportion of excess mortality was identified as COVID for the 45–64 age band, whereas the 0–44 age band has experienced significant non-COVID excess mortality, as shown in Table 5.6...

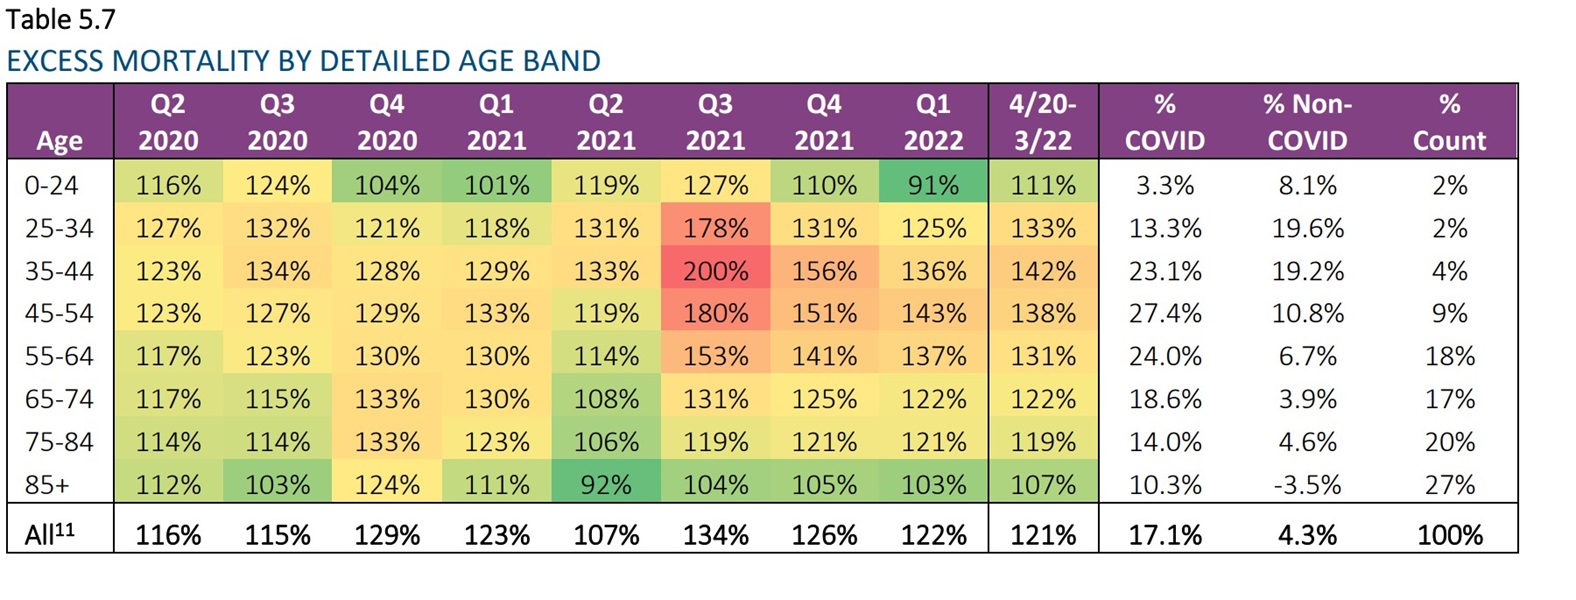
The greater age band detail in Table 5.7 provides further insight on excess mortality by age. The youngest age bands saw significant improvement in the last two quarters, but the working age population continues to see the highest A/E ratios. The overall A/E ratios are similar (but slightly higher) by amount versus count for age bands below 65. For age bands over 65, A/E ratios tend to be higher by amount than count by approximately 10%.”

© 2022 by the Society of Actuaries Research Institute. All rights reserved
