August 4, 2023
FRED
Federal Reserve Bank of St. Louis
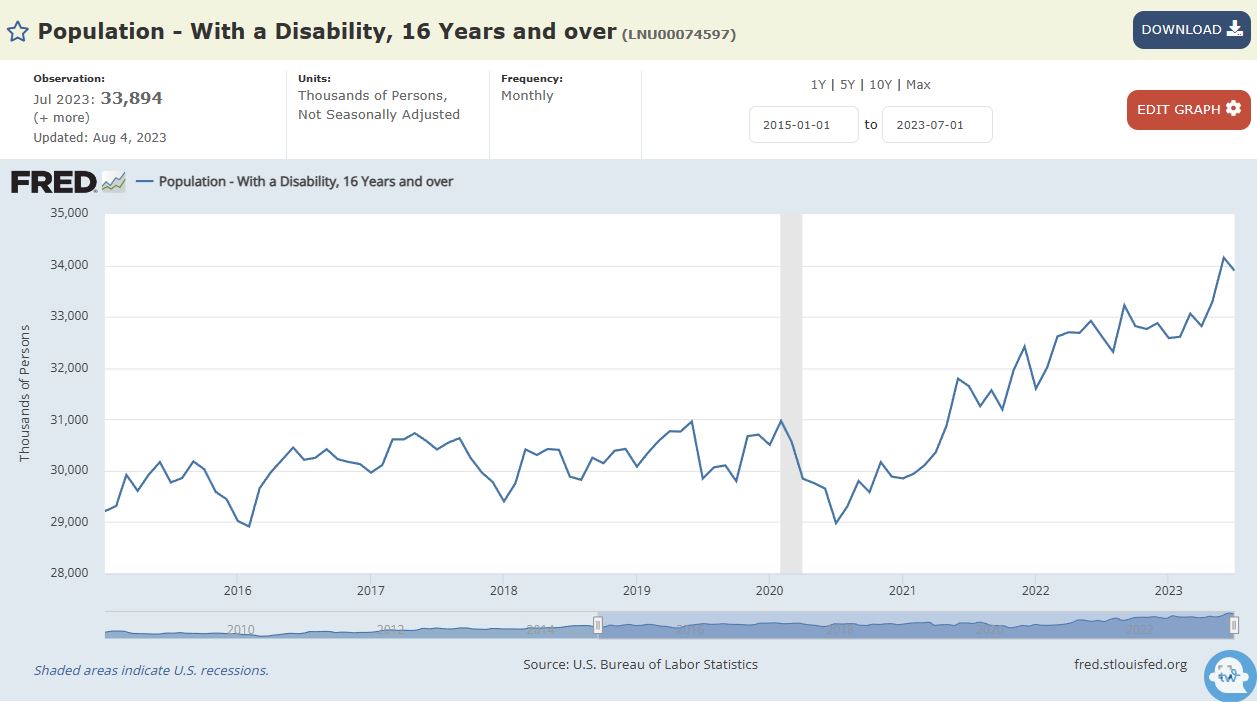
Estimated number of people in the US who are 1) disabled and 2) 16 years or older grew by 13.4% between December 2020 and June 2023.
13.4% = (33,894,000 - 29,887,000) / 29,887,000
- 29,447,000 = December 2015
- 30,131,000 = December 2016
- 29,780,000 = December 2017
- 30,426,000 = December 2018
- 30,705,000 = December 2019
- 29,887,000 = December 2020
- 32,420,000 = December 2021
- 32,874,000 = December 2022
- 33,894,000 = July 2023

Legal Notices, Information and Disclaimers
https://fred.stlouisfed.org/legal/
What can I do with FRED data?
You can do a lot of things with FRED data, graphs, maps, software, and mobile apps for your own personal, non-commercial use such as...
- Make cool graphs and maps and share them with friends
- Download data into Excel for homework assignments
- Support your policy stance on Facebook or your blog
- Make a sweet app using our FRED through our free API
Just be sure to mention FRED as the service from which you retrieved the data and keep any copyright notices that appear with the data on FRED.
document
COVID-19,disabilities,health statistics
